🎨 Visualization & Biological Interpretation
One of the primary goals of SiCell.jl is to transform complex single-cell datasets into clear and interpretable biological insights through high-quality visualizations.
From exploratory analysis and cell-type identification to trajectory analysis and uncertainty mapping, SiCell provides a comprehensive visualization framework designed for both computational scientists and experimental biologists.
🧭 UMAP Embeddings
UMAP provides a two-dimensional representation of the cellular transcriptional landscape, preserving local relationships between cells.
run_umap!(obj)

dim_plot(
    obj,
    group="cell_type"
)
Typical applications include:
- Identifying major cell populations
- Visualizing cellular heterogeneity
- Assessing batch integration quality
- Inspecting quality-control effects
Biological Interpretation
- Distinct islands suggest transcriptionally distinct cellular populations.
- Continuous gradients often indicate differentiation or state transitions.
- Mixed regions may represent transitional or plastic cellular states.
🧩 Clustering Visualizations
SiCell supports both graph-based and centroid-based approaches for identifying cellular populations.
Graph-Based Clustering
run_graph_clustering!(obj)

dim_plot(
    obj,
    group="graph_cluster"
)
Graph-based clustering is particularly useful for:
- Detecting rare populations
- Identifying subtle cellular substructures
- Discovering previously unrecognized biological states
K-Means Clustering
run_kmeans_clustering!(obj, k=8)

dim_plot(
    obj,
    group="cluster"
)
K-means provides:
- Rapid exploratory analysis
- Scalable clustering for large datasets
- Benchmark comparison against graph-based methods
🏷️ Cell Type Annotation
Cell populations can be automatically annotated using marker references from PanglaoDB.
annotate_cells!(
    obj;
    database="PanglaoDB"
)

dim_plot(
    obj,
    group="cell_type"
)
Biological Interpretation
Automated annotation enables rapid identification of:
- Immune populations
- Stromal populations
- Epithelial populations
- Endothelial populations
- Disease-associated cellular states
Cells labeled as Unknown may represent poorly characterized, rare, or disease-specific transcriptional programs.
🧬 Feature Plots
Feature plots visualize the spatial distribution of individual genes across the cellular manifold.
feature_plot(obj, "CD3D")Common applications include:
- Validating marker genes
- Confirming cell identities
- Investigating pathway activity
- Identifying potential biomarkers
Example questions:
- Which populations express a gene of interest?
- Is expression restricted to a specific state?
- Does expression follow a developmental trajectory?
📊 Violin Plots
Violin plots compare gene expression distributions across cellular groups.
violin_plot(
    obj,
    "MS4A1",
    group="cell_type"
)
They are useful for:
- Marker validation
- Interpreting differential expression results
- Creating publication-quality figures
🔥 Heatmaps
Heatmaps summarize gene-expression patterns across clusters or annotated cell types.
heatmap_markers(obj)Typical applications:
- Cluster characterization
- Cell-type discovery
- Marker comparison
- Supplementary figure generation
🌋 Volcano Plots
Volcano plots visualize differential-expression results by combining effect size and statistical significance.
volcano_plot(markers)They are valuable for:
- Prioritizing marker genes
- Discovering candidate biomarkers
- Comparing transcriptional changes between populations
🌊 Diffusion Pseudotime
SiCell implements diffusion-based trajectory inference to reconstruct continuous biological processes.
run_diffusion_map!(obj)

run_pseudotime!(obj, root_cell)
Biological Applications
- Developmental differentiation
- Cellular activation
- Response to environmental stimuli
- Disease progression and tumor evolution
Interpretation
Cells close to the chosen root state have low pseudotime values, while progressively differentiated or altered states have higher pseudotime values.
🌱 Trajectory Uncertainty Framework (TUF)
Traditional pseudotime assigns a position along a trajectory but does not quantify whether the local trajectory structure is consistent or ambiguous.
The Trajectory Uncertainty Framework (TUF) provides two complementary measurements:
- TES (Temporal Entropy Score) identifies neighborhoods containing cells from heterogeneous temporal states.
- TDS (Trajectory Divergence Score) identifies regions where forward developmental directions diverge.
Together, TES and TDS reveal different forms of local trajectory uncertainty.
Visualizing TES and TDS
trajectory_uncertainty_plot(obj; reduction="umap", key_prefix="traj_unc")
Biological Interpretation
High TES
May indicate:
- Transitional cellular states
- Temporal mixing of developmental programs
- Cellular plasticity or reprogramming
High TDS
May indicate:
- Branch points
- Competing lineage trajectories
- Divergent cell-state transitions
Combined Interpretation
| TES | TDS | Interpretation |
|---|---|---|
| Low | Low | Stable, well-defined trajectory |
| High | Low | Temporal heterogeneity without strong directional divergence |
| Low | High | Directional branching or fate divergence |
| High | High | Complex transitions involving multiple temporal and directional programs |
🕸️ Connectivity & Lineage Graphs
Population-level relationships can be visualized using PAGA-style connectivity graphs.
plot_paga(obj)Interpretation
- Nodes represent cell populations.
- Edges represent transcriptional connectivity between populations.
- Stronger connections suggest closer developmental or functional relationships.
These graphs provide a high-level overview of tissue organization and potential lineage relationships.
🎯 Building a Biological Story
SiCell visualizations are designed to work together as a complete analytical workflow:
- UMAP visualization reveals cellular organization.
- Clustering identifies discrete populations.
- Cell-type annotation assigns biological identity.
- Feature plots validate markers and pathways.
- Differential expression identifies molecular drivers.
- Pseudotime reconstructs continuous processes.
- TES and TDS highlight uncertain, transitional, and branching regions.
Together, these analyses transform raw sequencing counts into biologically meaningful hypotheses.
📈 Complete Analysis Workflow
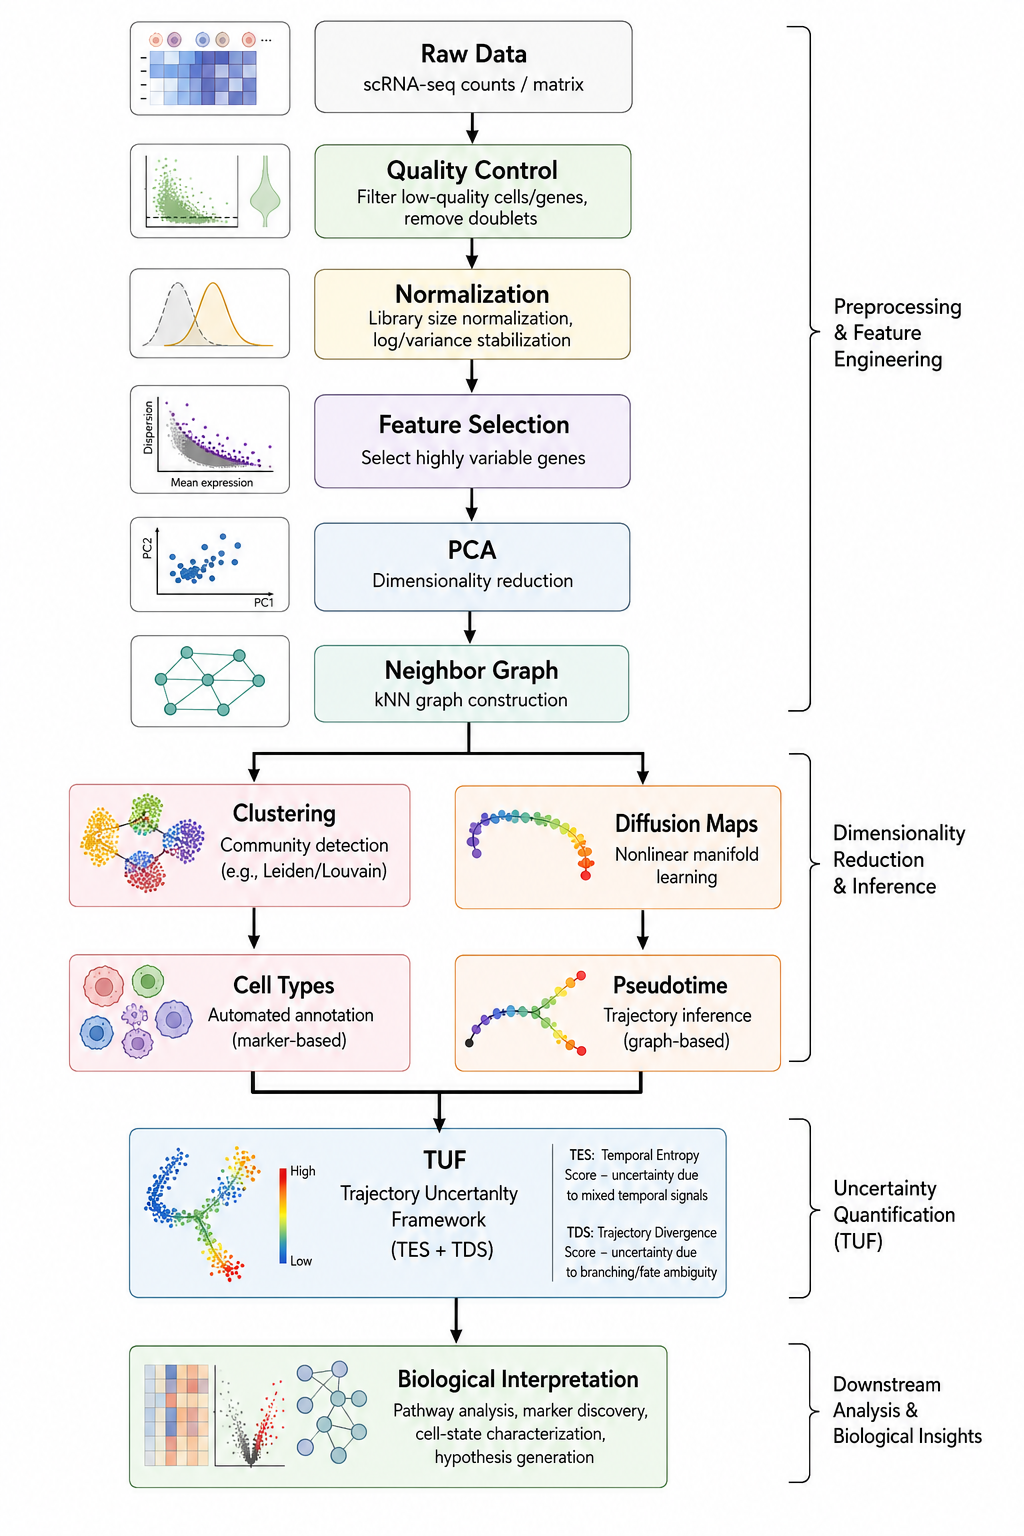 Overview of the SiCell.jl Analysis Pipeline
Philosophy
SiCell is built around a simple principle:
Single-cell analysis should not stop at computation — it should accelerate biological discovery.
Every visualization in SiCell.jl is designed to help researchers move efficiently from raw data to interpretable biological insights while maintaining reproducibility and scalability.